3.7 Sulphur For Pastures
Role in Plant
Sulphur (S) is essential for plant growth and is absorbed
by the plant in the sulphate form. S is involved in cell development and
in some amino acids, as well as an essential element for nitrogen fixation
and chlorophyll formation. Plants with adequate S nutrition contain
between 0.2 and 0.35% S.
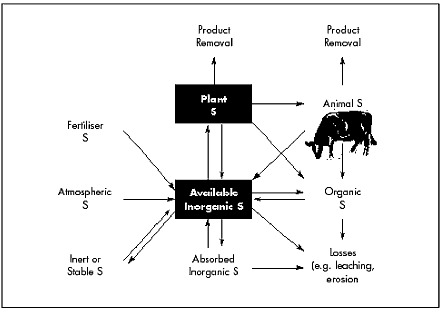
S Cycle
When applied to the soil as sulphate, fertiliser S forms
part of the inorganic S. Elemental fertiliser S requires an oxidation
process to form the available S. The fate of this inorganic pool of S can
be seen in the S cycle.

The major losses of S from the pasture system are due to
animal removal, leaching and fixation into organic S. At any one time over
95% of the S is in the organic form. Therefore, those processes that
favour mineralisation will increase S supply to the pasture.
Figure 1:
Potassium requirements by enterprise
| Colwell
K (mg/kg) |
Kg/ha
K |
| <40 |
40-80 |
80-120 |
>120 |
|
Hay/non dairy irrigated pasture |
45 |
30 |
15 |
0 |
|
Dairy <2 cows/ha |
40 |
25 |
10 |
0 |
|
Dairy >2 cows/ha |
60 |
40 |
20 |
0 |
|
Dryland pasture |
30 |
15 |
0 |
0 |
|
Irrigated lucerne |
60 |
40 |
20 |
0 |
Identification of S Status
S status of a pasture can be ascertained by:
-
Visual symptoms
-
Fertiliser strips
-
Soil tests
-
Plant tests
Visual symptoms
S deficiency is more likely to be seen in legumes than
grasses. Plants that are S deficient tend to be light green to pale yellow
in colour.
Fertiliser strips
S deficiency can be identified with test strips, but S
deficiency is seasonal and it is difficult to predict an S response due to
changing weather conditions.
Soil tests
Soil tests for S have been experimented with over the
years, with limited success. However, recent work has produced an S test
(KCl-40) that measures the inorganic and part of the organic S. A typical
calibration is shown. A critical range of 5 to 8mg/kg extractable S is
suggested
Figure 2
Extractable S - critical levels for pasture production
The interpretation of soil S tests needs to take into
account soil type and the weather conditions at time of sampling, ie
values will be lower in sandy soils that are dry.
Figure 3:
Critical S concentrations in pasture tissue
|
Species |
Critical
S concentration (%) |
|
Young tissue |
Whole shoot |
|
Annual medic |
0.18 - 0.25 |
0.17 - 0.19 |
|
White clover |
0.22 - 0.26 |
0.15 - 0.20 |
|
Sub clover |
0.18 - 0.30 |
0.19 - 0.25 |
|
Lucerne |
0.20 - 0.28 |
0.17 - 0.21 |
|
Phalaris |
0.21 - 0.25 |
0.21 - 0.23 |
|
Perennial ryegrass |
0.18 - 0.22 |
0.18 - 0.23 |
Figure 4:
Sulphur applications to maintain adequate S nutrition (Kg/haS)
| Extractable
soil S |
(mg/kg) |
| <5 |
5-10 |
10-15 |
>15 |
|
Sandy loam/loam |
15 |
10 |
5 |
0 |
|
Sand |
20 |
15 |
10 |
0 |
Plant tests
Plant tests for S are very reliable if young tissue is
collected. A range of critical concentrations for a range of pasture
species is shown in Figure 3.
Values are for plants actively growing. Critical
concentrations for whole shoots will decrease rapidly as flowering and
maturity approaches.
How much S to apply
In most pasture situations, the S has been added with the
phosphorus as a form of by-product. However, with the move to high
analysis products, S inputs have been reduced in some instances. Generally
S will be required for pastures growing on sands through to loams. The
rate of S applied will depend on the stocking rate, texture and amount of
S in the soil. Removal figures for S are listed in Figure 5.
Figure 5:
Removal of S by product
|
Product |
S removal (kg) |
|
Legume hay (1t) |
2.0 kg S |
|
Wool (5kg) |
0.2 kg S |
|
Meat (50kg) |
0.4 kg S |
|
Milk (1000 litres) |
0.6 kg S |
As a guide to the S rate required to maintain adequate S
nutrition, figures can be taken from Figure 3.
Product
S can be directly applied to the soil as gypsum (CaSO4),
but is more likely to be added with the phosphorus fertiliser either in
the sulphate or elemental S form. Trial work suggests that, with adequate
rainfall, either form is suitable.

3.7 Sulphur For Pastures
[ Back ] [ Next ]
|
