3.5 Phosphorus
Role in Plant
Phosphorus (P) is essential for pasture growth and has a
major role in promoting early root growth. It also improves the plants
resistance to cold and moisture stress. Most growing tissue, with adequate
P nutrition, contains between 0.2 and 0.4% P.
P Cycle
Within the pasture system fertiliser P moves into the soil
as inorganic P. This P has a number of fates as shown: (figure
1)
Figure 1:
P cycle in a pasture

Click for larger image.
The major "losses of P in the pasture/soil system are
due to tie up in organic matter, fixing in unavailable forms e.g. Al, Fe
and Ca phosphates, leaching in sandy soils and removal in animal or plant
products.
Identification of P Status
The need for P in a pasture system can be ascertained by:
-
Visual symptoms
-
Fertiliser strips
-
Soil testing
-
Plant testing
Visual symptoms
P deficiency shows as a dark blue green to purple red
colourations. These symptoms will only appear in plants grown in extremely
deficient soils.
Fertiliser strips
Applying a range of P rates can give a good guide to P
status. However, management and accurate measurements of yield differences
are generally difficult to obtain by a farmer.
Soil tests
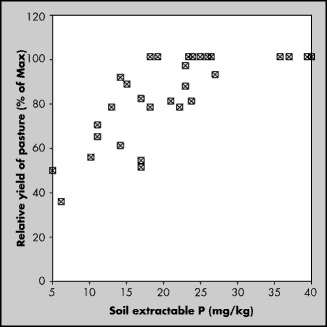
By far the most used method of determining the P status is
soil testing. Critical soil extractable P tests have been obtained for
pastures using mowing trials. A typical calibration for pasture is shown:
Figure 2:
Extractable Colwell P Soil Test

Figure 3:
Critical extractable Colwell soil P values for pastures are:
|
Species |
Soil |
Critical extractable
P
concentration (mg/kg) |
|
Sub clover |
Sand/clay duplex |
20 - 25 |
|
Sub clover |
Sandy loam |
25 - 30 |
|
Medic |
Sandy mallee |
15 - 20 |
|
Medic |
Sandy mallee |
25 - 35 |
It is suggested that these values may be higher under
heavy grazing pressure.
Plant tests
Plant tests provide a guide to the plants nutritional
status. Traditionally plant testing for P in pastures has not been used to
a large extent. However, reliable P tests are available and the critical
concentrations are:
Figure 4:
Critical concentrations in pasture tissue
|
Species |
Critical P concentration
(%) |
xxx |
|
Young tissue |
Whole shoots |
|
Annual medic |
0.30 - 0.40 |
0.26 - 0.35 |
|
White clover |
0.30 - 0.34 |
0.25 - 0.30 |
|
Sub clover |
0.30 - 0.40 |
0.28 - 0.32 |
|
Lucerne |
0.20 - 0.25 |
0.21 - 0.26 |
|
Phalaris |
0.20 - 0.25 |
0.18 - 0.20 |
|
Perennial rye grass |
0.20 - 0.28 |
0.20 - 0.25 |
Note: Values are for plants collected prior to flowering
and when plants are vegetative and actively growing.
How much P to apply
A number of factors will determine the rate of P to apply
to a pasture. These include:
The removal of nutrients from a grazing system are:
Figure 5:
Removal of P by product
|
Product |
P Remobal (kg) |
|
Legume hay (1t) |
2.5 kgP |
|
Wool (5kg) |
0.02 kgP |
|
Meat (50kg) |
0.4 kgP |
|
Milk (1000 litres) |
1.0 kgP |
The P rate required to maintain the P status of a soil and
provide adequate nutrition, can be obtained from the following table:
Figure 6:
P rate required to maintain the P status of soil
|
Extractable Colwell P
(mg/kg)
xx |
kg/haP/DSE |
xx |
xx |
xx |
|
<10 |
10 - 18 |
18 - 25 |
>25 |
|
Sand/sandy loam |
1.15 |
1.1 |
1.05 |
1 |
|
Loam |
1.25 |
1.2 |
0.95 |
0.8 |
|
Clay loam/clay |
1.4 |
1.3 |
0.9 |
0.7 |
|
Ironstone |
1.7 |
1.6 |
1.5 |
1.3 |
i.e. Pasture on a sandy loam soil with an extractable P
of 16mg/kg running 12 DSE would require 12 x 1.1 kgP = 13 kg/P.
Product
-
The P product used will depend on:
Price per unit of P.
-
Rate of sulfur required (and other nutrients).
-
Soil factors (pH, leaching potential etc.)
-
Seasonal conditions

3.5 Phosphorus
[ Back ] [ Next ]
|
