3.6 Potassium for Pastures
Role in Plant
Potassium (K) is an essential macronutrient for plants,
being required for photosynthesis, cell formation and cation-anion
balance. Most pasture plants contain high amounts of K i.e. 1 to 4%.
K cycle
The uptake of K by plants is almost entirely from the soil
solution. Plant factors that influence the uptake of K are:
-
Plant age
-
Transpiration rate
-
Root distribution
-
Plant morphology
-
Soil factors that influence K uptake are:
-
Those influencing K diffusion i.e. water content,
temperature.
-
Soil buffering capacity.
The movement of K in the soil can be illustrated by the
following cycle:
Figure 1:
Soil K Cycle

Identification of K status
K status can be ascertained by:
-
Visual symptoms
-
Fertiliser strips
-
Soil tests
-
Plant tests
Visual symptoms
K deficiency in legumes appears in the older leaves and is
characterised by a white spotting of the leaves a bronze colouration and
dying of tissue from the edges. Deficiencies are more likely in legumes
than grasses.
Fertiliser strips
Fertiliser strips are quite a useful tool to diagnose K
deficiency but they require careful management.
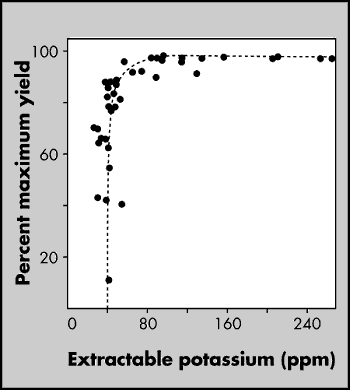
Figure 2:
Colwell K- Critical values for pasture production.

Soil tests
Soil tests for K have been developed for pasture species
on a range of soil types. Within SA a good calibration has been developed
for the Colwell K test as seen in the following diagram. Critical values
of between 80 and 120 mg/kg extractable K have been proposed.
Plant tests
Plant tests for K in pasture plants are very reliable but
as with other nutrients young tissue needs to be analysed.
Figure 3:
Critical concentrations of K in pasture tissue.
|
Species
|
Critical K
concentration (%) |
|
Young tissue |
Whole shoots |
|
Annual medic |
1.0 - 1.5 |
1.0 - 1.4 |
|
White clover |
1.7 - 1.9 |
0.8 - 1.2 |
|
Sub clover |
1.5 - 2.5 |
1.0 - 2.0 |
|
Lucerne |
1.8 - 2.4 |
1.3 - 1.4 |
|
Phalaris |
1.7 - 2.0 |
1.4 - 1.6 |
|
Perennial rye grass |
1.4 - 1.9 |
1.0 - 1.5 |
Ratios of K/Ca + Mg in the plant have been used to
identify grass tetany prone pastures. Values greater than 2.2 will predict
pastures that may cause problems.
How much K to apply
Pasture systems that lead to large dry matter removals can
lead to K deficiency.
Figure 4:
Removal of K by product
|
Product |
K removal (kg) |
|
Legume hay (1t) |
10.0 |
|
Wool (5kg) |
Trace |
|
Meat (50kg) |
0.3 |
|
Milk (1000 litres) |
1.5 |
Taking these figures into account along with soil K
concentration the following table gives a guide to K requirements.
Figure 5:
Potassium requirements by enterprise/
|
Colwell K (mg/kg) |
Kg/ha K |
|
<40 |
40-80 |
80-120 |
>120 |
|
Hay/non dairy irrigated pasture |
45 |
30 |
15 |
0 |
|
Dairy <2 cows/ha |
40 |
25 |
10 |
0 |
|
Dairy >2 cows/ha |
60 |
40 |
20 |
0 |
|
Dryland pasture |
30 |
15 |
0 |
0 |
|
Irrigated lucerne |
60 |
40 |
20 |
0 |
|
Dryland lucerne |
0 |
0 |
0 |
0 |
Product
K is generally supplied to pastures as muriate of potash
(50%K) as a stand-alone fertiliser or blends with phosphorus and sulfur
products.

3.6 Potassium for Pastures
[ Back ] [ Next ]
|
